Understand the home dashboard
Pick the Dashboard's period and currency and learn exactly how each number and each chart is calculated.
The HomeDashboard is the first screen of every store. It sums up a period's sales and subscriptions: how much came in, how much went back in refunds, how much the store bills per month in subscriptions and how many subscribers left. Every team role sees the Dashboard, including Sales.
While the store is not ready to sell, the top shows the Getting started card with the steps still missing: pick the plan, wait for the account provisioning, connect a provider, create a product with an offer and make the first sale. The card goes away when every step is done.
Pick the period and the currency
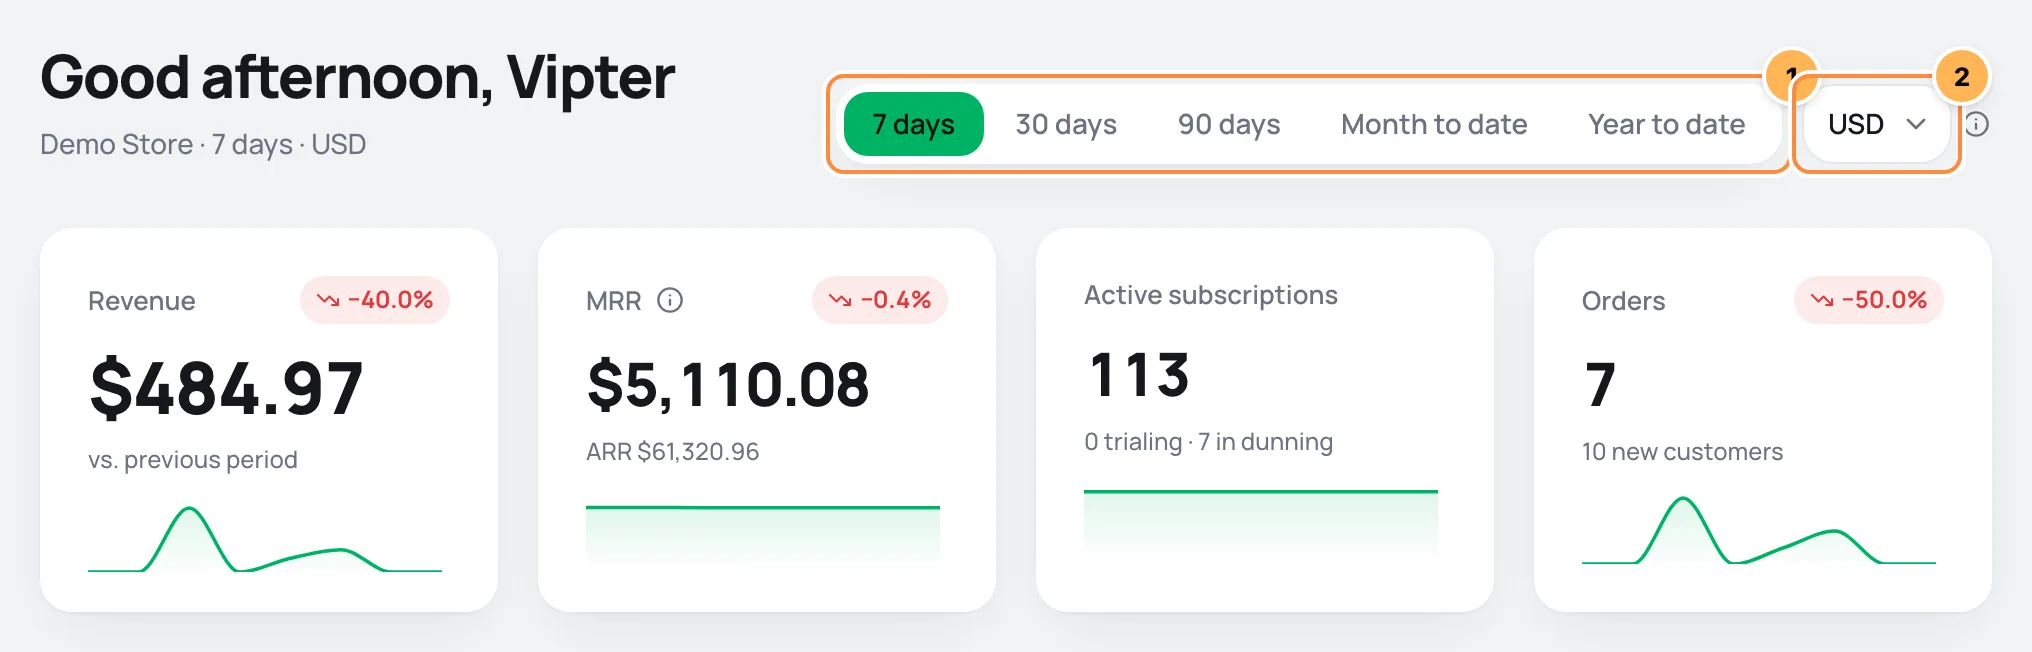
- Period: 7 days, 30 days (the default), 90 days, Month to date or Year to date. The first three count back from now. Month to date starts on the 1st of the month, and Year to date on January 1.
- Currency: the selector only shows when the store has orders in more than one currency. Every amount on the screen is shown in the chosen currency. The store's currency comes selected.
The period and the currency stay in the page address (?range=90d¤cy=BRL). A copied link opens the same view.
Conversion is only for comparing
Amounts in another currency are converted at the reference rate stored for the day of each order. It is only a way to add everything up on one screen: Vipter does not convert money, and each charge stays in the currency it was made in.
The comparison with the previous period
The green and red badges next to the numbers compare the chosen period with the period of the same length right before it. In 30 days, for example, the previous 30 days. Green means improvement: for refunds, chargebacks, cancellations and churn, a drop shows in green. With no value in the previous period, there is no comparison and the badge does not show.
The four main numbers
| Card | What it shows |
|---|---|
| Revenue | The period's Gross volume minus the Refunds made in the period. It is the net revenue. |
| MRR | The monthly recurring revenue right now. Below it, the ARR, which is 12 times the MRR. |
| Active subscriptions | Active subscriptions at the end of the period, including those in dunning. Below it, how many are in trial and how many are in dunning right now. |
| Orders | Orders paid in the period. Below it, how many new customers were added in the period. |
The thin line at the bottom of each card shows the shape of the period, day by day.
Revenue health
| Indicator | How it is calculated |
|---|---|
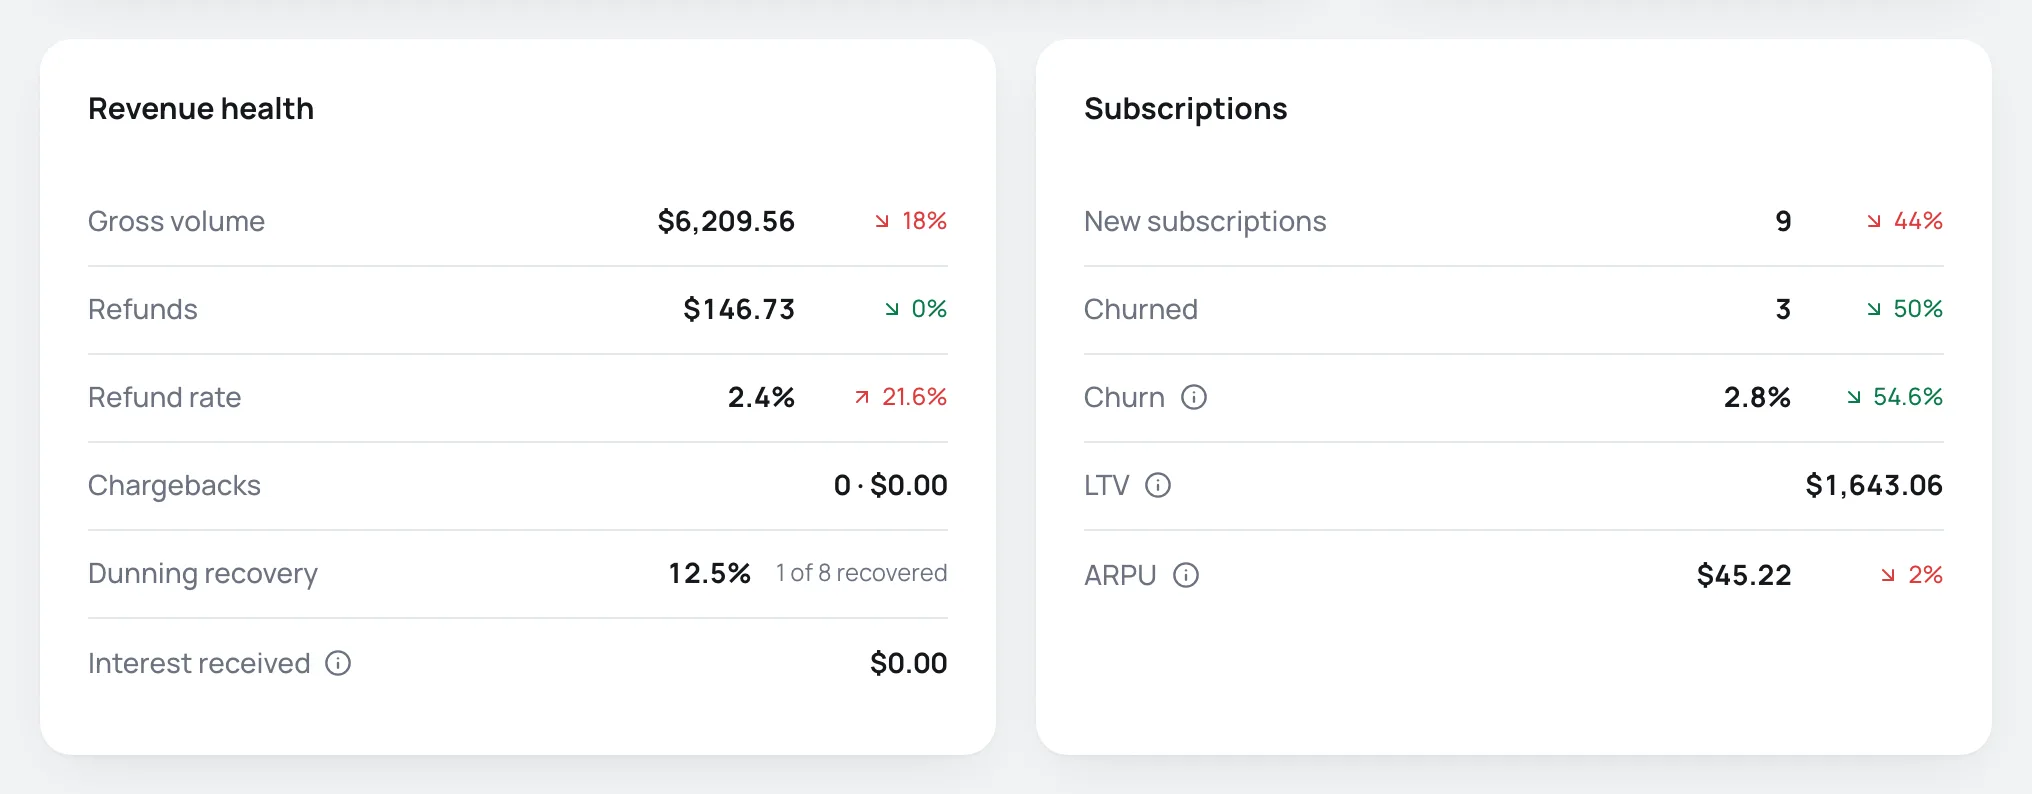
| Gross volume | Sum of the orders paid in the period, by payment date. Orders refunded later still count here. It leaves out the card check at the start of a free trial and saving a card without a charge. |
| Refunds | Sum of the refunds made in the period, by refund date, partial or full. Refunds that failed or were canceled are left out. Refunds recorded by hand, with a manual status, count. |
| Refund rate | Refunds ÷ Gross volume of the same period. |
| Chargebacks | Number and amount of the orders with status Charged back, counted by the date of the order's last update. |
| Dunning recovery | Of the subscriptions that went into dunning in the period, how many became active again within 30 days. Next to it, the total: "3 of 8 recovered". |
| Interest received | Installment interest the store kept on sales paid in the period: the total charged minus the product price. It only counts orders in the chosen currency, with no conversion. See Installments. |
Subscriptions
| Indicator | How it is calculated |
|---|---|
| New subscriptions | Subscriptions that started in the period. |
| Churned | Subscriptions that ended in the period. |
| Churn | Churned in the period ÷ subscriptions that were active at the start of the period. |
| LTV | How much a subscriber should pay over the whole relationship: ARPU ÷ Churn. To avoid an infinite value when almost nobody cancels, the churn used in the calculation is at least 0.5%. |
| ARPU | Average revenue per subscriber: MRR ÷ active subscriptions at the end of the period. |
How MRR is added up
MRR adds up the monthly amount of each active subscription or subscription in dunning. Cycles other than monthly are converted to one month: a yearly plan counts as 1/12 of its amount, a quarterly one as 1/3, a semiannual one as 1/6. Biweekly, daily and custom-cycle plans count by the number of days in the cycle. Paused, trialing and canceled subscriptions are left out.
The charts
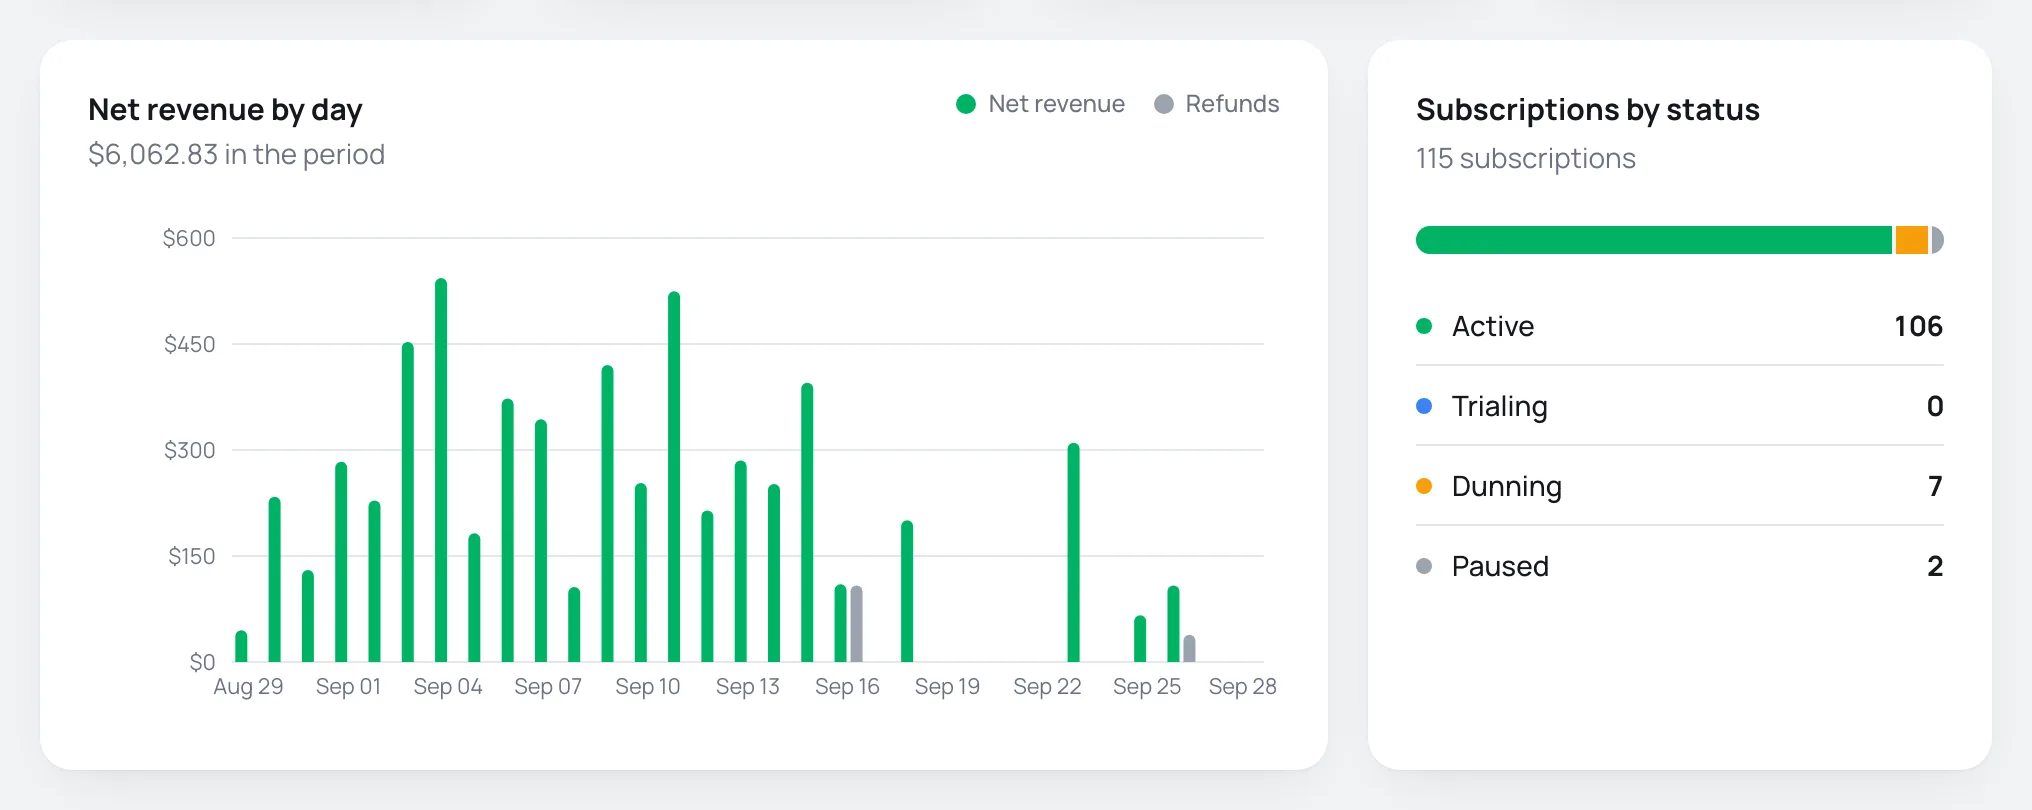
- Net revenue by day: one bar per day with the Net revenue and another with the day's Refunds.
- Subscriptions by status: how many subscriptions are now Active, Trialing, Dunning and Paused.
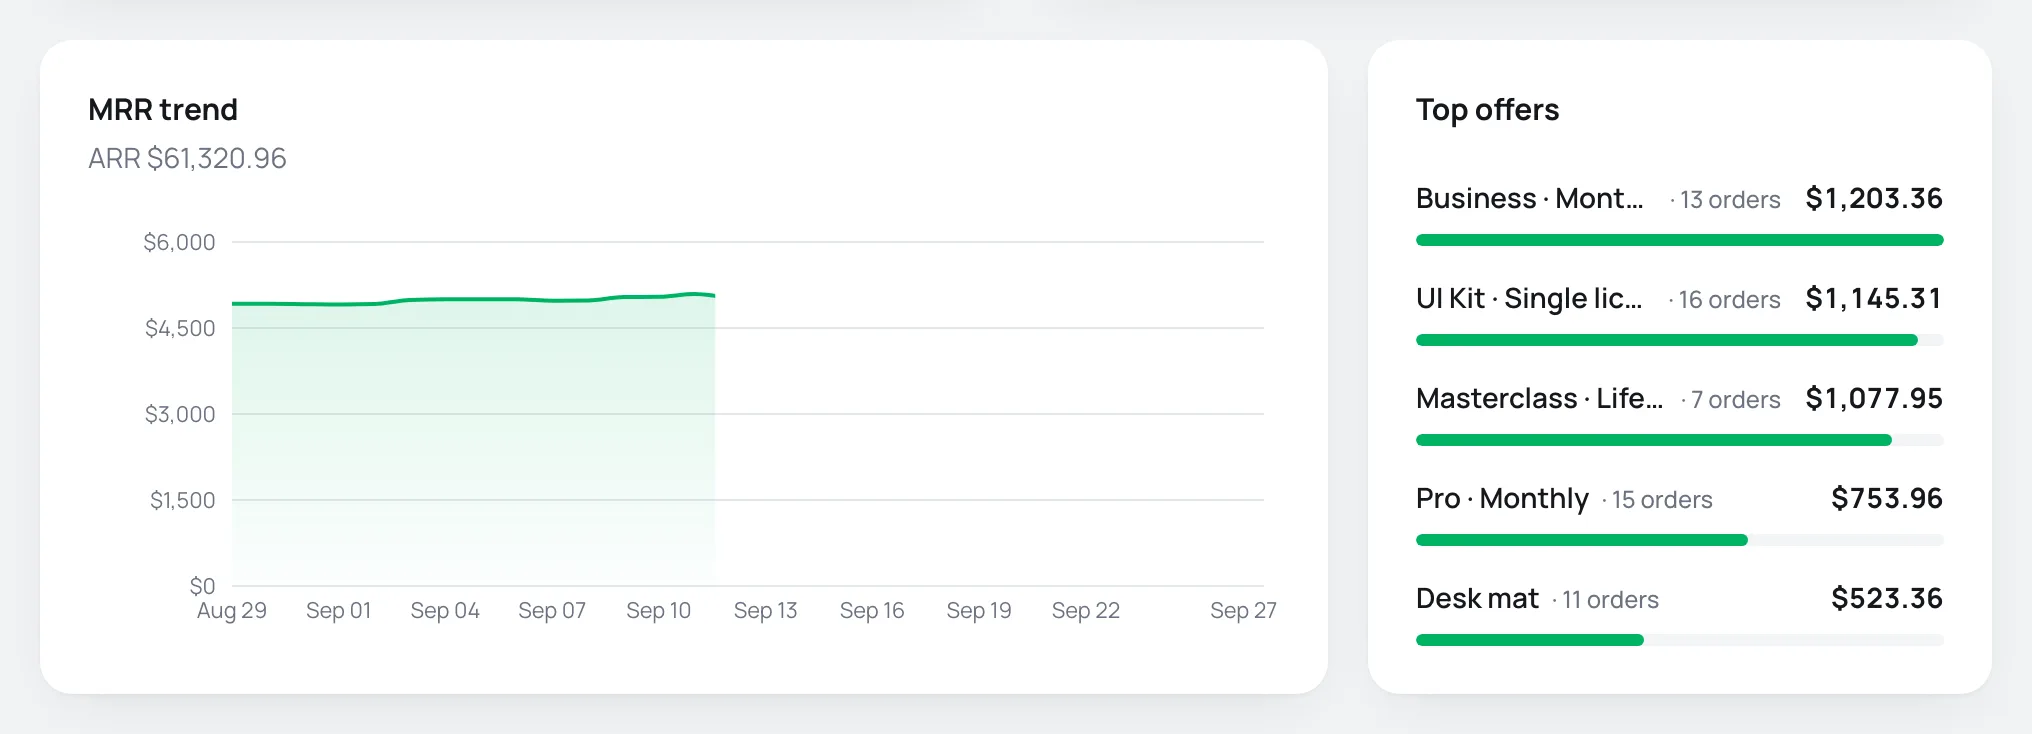
- MRR trend: the MRR recorded day by day. Vipter stores each store's MRR once a day, with the previous day's close, so today only shows in the chart tomorrow.
- Top offers: the 5 offers that billed the most in the period, with the number of orders. An order bump counts for its own offer, not for the order's main offer. Click the name to open the offer.
Common questions
-
The Revenue does not match the sum of the transactions list.
The Dashboard counts by payment day and subtracts refunds by the day they were made. The transactions list filters by the day the order was created and shows every status, including pending and declined ones.
-
The Active subscriptions number does not match the sum of the status chart.
The card counts active subscriptions and those in dunning at the end of the period. The chart shows the situation right now and also adds the paused ones.
-
The currency selector does not show.
All of the store's orders are in a single currency. It shows up when the first order in another currency comes in.
What to do next
- See and filter orders in Transactions: search and filter.
- Learn the subscription statuses in Subscriptions: lifecycle and statuses.
Installments and interest
Offer card installments on sales in reais, with interest-free installments, a minimum installment and monthly interest calculated with the Price table.
Transactions: search and filter
Find an order by its number or the buyer's e-mail, filter by status, seller and period, and read each column of the list.